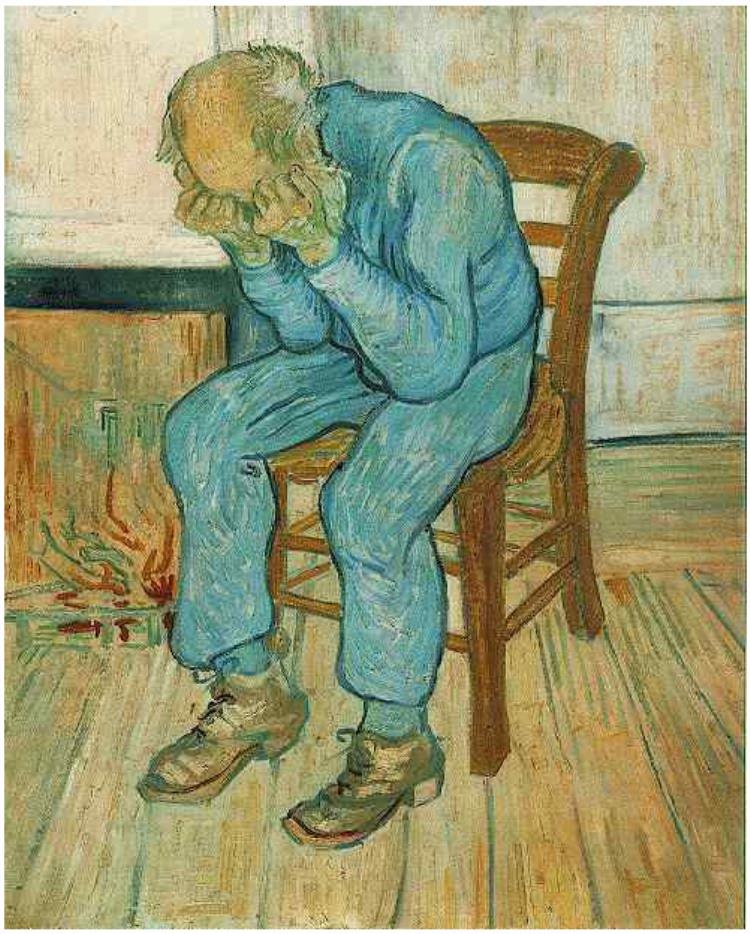
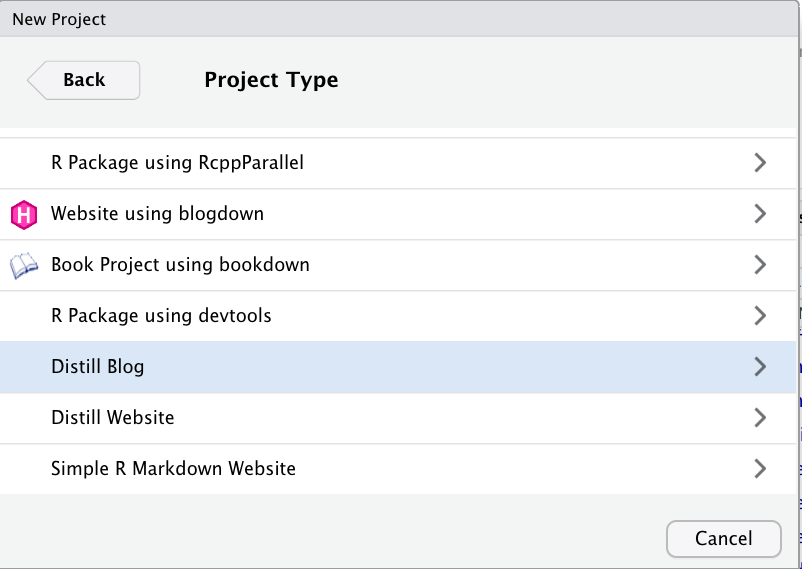
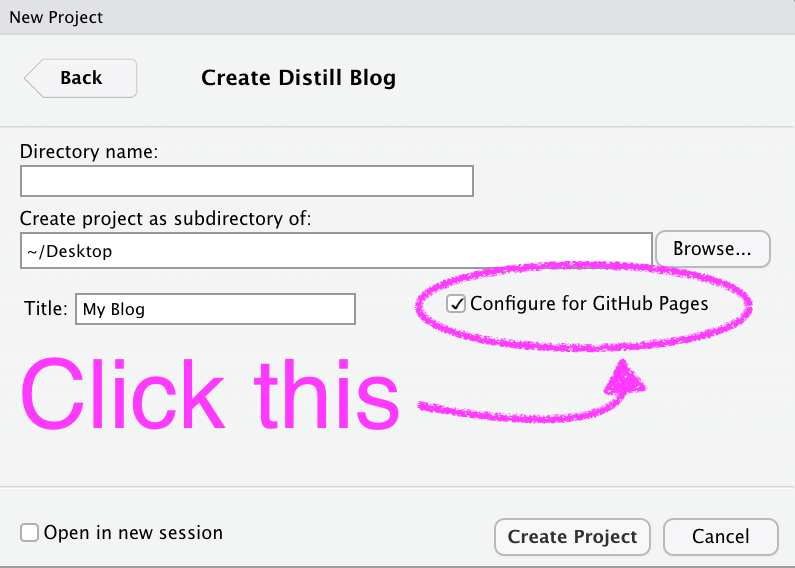
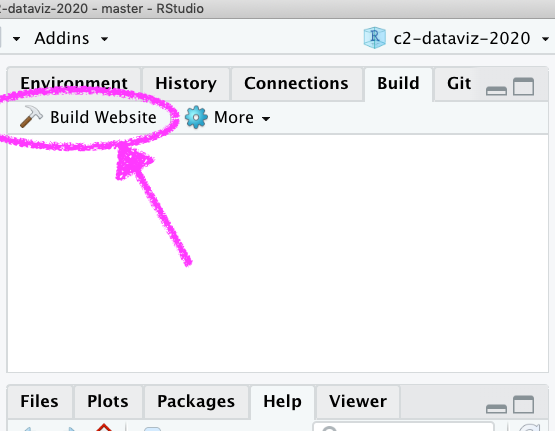
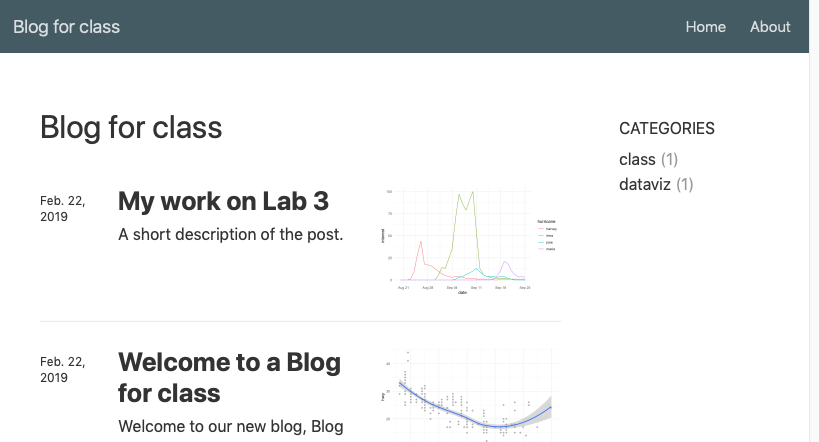
class: center, middle, inverse, title-slide # Websites with Distill ### Daniel Anderson ### Week 8, Class 2 --- layout: true <script> feather.replace() </script> <div class="slides-footer"> <span> <a class = "footer-icon-link" href = "https://github.com/uo-datasci-specialization/c2-dataviz-2021/raw/main/static/slides/w8p2.pdf"> <i class = "footer-icon" data-feather="download"></i> </a> <a class = "footer-icon-link" href = "https://dataviz-2021.netlify.app/slides/w8p2.html"> <i class = "footer-icon" data-feather="link"></i> </a> <a class = "footer-icon-link" href = "https://github.com/uo-datasci-specialization/c2-dataviz-2021"> <i class = "footer-icon" data-feather="github"></i> </a> </span> </div> --- class: inverse-blue # Data viz in Wild Anwesha Ping ### Makayla on deck --- # Agenda * Introduce Distill * Deployment -- ### Learning objectives * Get at least a basic site deployed -- By the end of the day! You will have a site! --- class: inverse-red center middle # Distill https://rstudio.github.io/distill/ --- # Disclaimer and assumptions * This is a very basic intro + Distill can do a lot that we won't get to * I assume most of you have never created or deployed a website before + If you have, some of this might be slow but you can help others * Distill was recently updated to include newer themeing features, among other things. Checkout the [website](https://rstudio.github.io/distill/) for the most complete and up-to-date info * This "lecture" will be highly interactive --- # Please follow along ```r install.packages("distill") # or remotes::install_github("rstudio/distill") ``` --- # Back to RStudio ### Create new project <img src = "img/create-blog.png" height = "350px"> --- # The steps * Create a new RStudio Project * Select distill blog - **Make sure** to Select "Configure for GitHub Pages" <img src = "img/distill-gh-pages.png" height = "350px"> --- # Author a new article * `distill::create_post()` * Create another one! --- # Build your website ![](img/website-build.png) --- class: inverse-blue middle # Connect to GitHub ## Use the project-first workflow and publish the docs folder .center[ [Demo] ] --- class: inverse-red center middle # That's basically it! 🎉 -- ## A few additional features --- # Categories * You make up the category names. Tag posts with those categories, and they will be linkable ```yaml --- categories: - dataviz - class --- ``` ![](img/categories.png) --- # Navigation All controlled with `_site.yml` * Let's add a github logo that links to our repo -- ``` --- navbar: right: - text: "Home" href: index.html - text: "About" href: about.html - icon: fa fa-github href: https://github.com/datalorax/class-site-example --- ``` --- # Create drop-down menus ``` --- navbar: left: - text: "Labs" menu: - text: "Getting Started with R" href: "lab1.html" - text: "Visualizing Distributions" href: "lab2.html" right: - text: "Home" href: index.html - text: "About" href: about.html - icon: fa fa-github href: https://github.com/datalorax/class-site-example --- ``` --- # Base URL Once your site is deployed (or you know the link it will be deployed to), change the `base_url` in the `_site.yml` * Gives some nice sharing features (twitter cards) * Allows you to use [citations](https://rstudio.github.io/distill/citations.html) --- # Drafts If you want to work on a post for a while without it being included in your website, use `draft = TRUE` `distill::create_post("My new post", draft = TRUE)` ``` --- title: "My work on Lab 3" description: | This lab was hard! draft: true --- ``` --- # Figures Change figure options with chunk options * `layout = "l-body"` (default) * `layout = "l-body-outset"` * `layout = "l-page"` * `layout = "l-screen"` + `layout = "l-screen-inset"` + `layout = "l-screen-inset shaded"` ### Try it out! --- # Additional figure options * Rather than using `![]()`, you can use `knitr::include_graphics()` to have the same options. * Use `fig.cap` in chunk options to give nice figure captions. * Note these options should work for tables as well --- # Side notes ``` <aside> This is some text that will appear in the margin - similar to Tufte's style. It is often used to provide extra detail. </aside> ``` -- You can also use this to show small plots ``` <aside> ggplot(mtcars, aes(mpg)) + geom_histogram() + labs(title = "Distribution of Miles Per Gallon") </aside> ``` --- # Customizing the theme Use `distill::create_theme("style")` * Creates a `style.css` file (or whatevs you want to call it in the above) * Modify `_site.yml` to ``` output: distill::distill_article: css: style.css ``` --- * Modify small elements ``` .distill-site-nav { color: rgba(255, 255, 255, 0.8); background-color: #455a64; font-size: 15px; font-weight: 300; } ``` becomes ``` .distill-site-nav { color: rgba(255, 255, 255, 0.8); background-color: #FF5FDD; font-size: 15px; font-weight: 300; } ``` --- # This can be fun! Just be careful not to go too far: from [Yihui](https://slides.yihui.name/2018-blogdown-rstudio-conf-Yihui-Xie.html#33) -- ### Debugging CSS, van Gogh (1890) .center[ <img src="https://slides.yihui.org/images/debug-van-gogh.jpg" height="300px" /> ] --- # Equations Use latex notation and it should "just work" `$$` `\mu = \frac{1}{n}\sum_{i=0}^n{x_i}` `$$` becomes .Large[ `$$\mu = \frac{1}{n}\sum_{i=0}^n{x_i}$$` ] --- # Other features * Table of Contents * Appendices * Citations + Both how to cite your article and bibliographies --- background-image:url("https://images.pexels.com/photos/346796/pexels-photo-346796.jpeg?auto=compress&cs=tinysrgb&dpr=2&h=750&w=1260") background-size:cover class: center # Go forth and share your work!