Customization of web pages with CSS
Daniel Anderson
Week 9, Class 2
Modifying these with CSS
Let's start by creating an RMarkdown document
Add a code chunk, but swap out r for css
Change the body font to Times New Roman (or whatever else you want) usings something like this
body { font-family: "Times New Roman";}We specify the thing we want to modify (body), then use curly braces, then put the corresponding CSS code. Note the CSS code always follows the form thing: modifier;.
Using google fonts
Go to fonts.google.com
Click on a font you're interested in. Once you decide you want it, click "Select this style".
Click the @import button, then copy the import code between <style> and </style>. Put this near the top of your CSS file (or chunk), then use the "CSS rules" to specifically refer to it.
Inspecting things
I highly recommend using Google Chrome's developer tools. It allows you to hover over things and see the corresponding style. You can even modify the style there to see what changes it will make.
Let's see if we can modify the background color for our code chunks in RMarkdown.
[Demo]
Writing a stylesheet
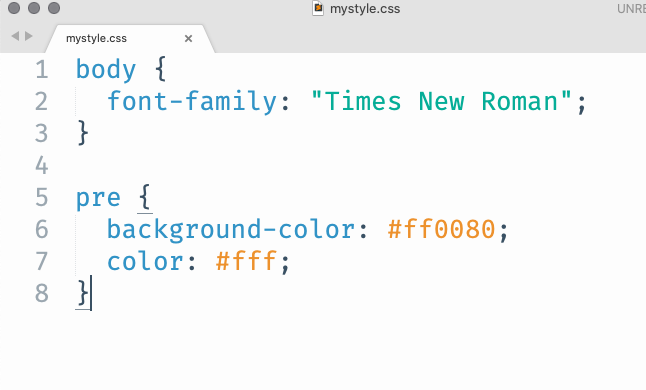
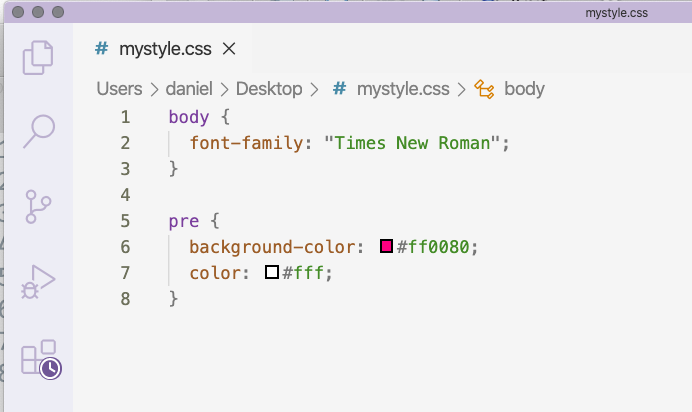
I would encourage you to try other text editors for writing style sheets. SublimeText and VS Code are probably the best options.


There are hundreds of styles, but the main point is that you can get appropriate code highlighting that you can't get through RStudio (to my knowledge).
More styling for our div
Let's say we wanted to create a call-out box (i.e., to bring the reader's attention to it). We could keep modifying our .attention CSS code to somethign like:
.attention { border: 3px solid #FF0380; border-radius: 10px; background-color: #ffadd6; font-size: 5rem; color: #fff; text-align: center;}Change the navbar color
A couple of ways to do this - modify .container-fluid or .navbar.
Let's change the navbar background color and the font. I'll add a bottom border too
@import url('https://fonts.googleapis.com/css2?family=Stick&display=swap');.container-fluid { background-color: #fff; font-family: 'Stick', sans-serif; border-bottom: 3px solid #00998c;}Style plot to match theme
library(ggplot2)library(showtext)font_add_google("Varela Round", "vr")showtext_auto()ggplot(mtcars, aes(disp, mpg)) + geom_point(color = "#001413", size = 3) + geom_smooth(color = "#00998c", fill = "#001413") + theme(plot.background = element_rect(fill = "transparent", color = NA), panel.background = element_rect(fill = "transparent", color = NA), panel.grid = element_blank(), text = element_text(family = "vr", size = 30, color = "#00998c"), axis.text = element_text(color = "#00998c"))You'll want to use dev.args = list(bg="transparent") in global knitr chunk options too.